➢The debugger will stop once at the beginning of each of the macro indices of each of the diary grid lines. Afterward, the debugger will only appear if you have placed a breakpoint.
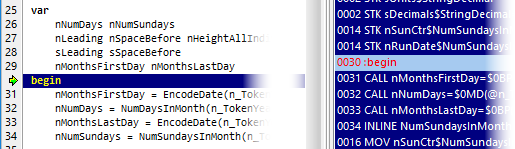
The debugger will already have initialized all variables and the instruction pointer will be placed at the begin marker of both the source code and the compiled code, as shown on the right.
To move through the code you can use of of the buttons at the bottom of the debugger (or the corresponding keyboard shortcut).

Next ASM Line |
F7 |
Use this to move by one line of compiled (also called assembler) code. When you use this mode, the tab containing the compiled code appears. You can switch back and forth between compiled and source code at any time. |
Next Source Line |
F8 |
Use this to move by one line of source code. Note that even if you are using this mode, you can still select the compiled code tab and view the progress in the compiled code. |
Next Breakpoint |
F9 |
Use this to move to the next line that corresponds to one of the breakpoints you set. |
Next Token |
F10 |
Use this to execute the rest of the current token without pause, and only stop when Q++Studio reaches the next Macro token. |
Stop Debug |
F11 |
Use this to stop debugging, but continue the diary generation. From this point on, diary generation will proceed as if you had opted not to invoke the debugger. |
Abort Script |
F12 |
Use this to stop debugging and abort the Script immediately. This is useful when you realize, while debugging, that there is a important error which would make the diary generation output useless. |
See also: debugger breakpoints.
Topic 127901, last updated on 01-Aug-2020